

“I hate waiting,” asserted Inigo Montoya, the almighty swordmaster from “The Princess Bride.” He is not alone; we all spend abundant resources to shorten our waiting times or distract ourselves from it. We buy a cup of coffee while waiting for a train, click elevator buttons repeatedly because we cannot wait any longer to reach our destination. This behavior is natural, as time is such an expensive resource, so we instinctively aim to conserve it.
Even worse than waiting for an elevator is waiting for data. We want to analyze data quickly, obtain our reports and predictions, and utilize them to drive value. This is why we felt it is critical to ensure we do not make data consumers wait too long for their data. And a quick and efficient solution without measuring capabilities is mediocre, which leads us to benchmarking!
Using TPC to Measure Snowflake SQL Performance
One of my hobbies is setting up fictitious organizations for demonstrations, as I did for our Snowflake Security guide, our Snowflake Row Level Security guide, and other guides. Since we are benchmarking now, though, it is best to use industry standards, as they are stable and extensively used in recent decades. We decided to use the TPC benchmarks, as they provide a complete benchmarking suite with sample datasets and a set of different queries for testing. An additional benefit of using industry-standard tests is to verify that our Data Access Controllers are working as planned with the queries.
Within TPC, which has different tests, I chose TPC-H and TPC-DS, both of which are decision support benchmarks. These are also the benchmarks Snowflake uses as benchmarking samples. To experiment with the test datasets of TPC-H and TPC-DS in your Snowflake account, go to a database named “SNOWFLAKE_SAMPLE_DATA” which contains benchmarking datasets with different scales.
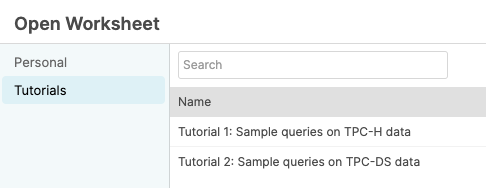
Snowflake even provides the SQL queries for TPC-DS and TPC-H benchmarks when you open a new worksheet under the tab “Open Tutorials”:
 Learn More:
- Blog: Data Security Projects Keep Data Teams Away From Their Core Responsibilities
- How Satori enables secure data access to Snowflake at scale
- Book a demo with one of our experts
Methodology
When measuring results, it is important to be as fair and objective as possible. Since Satori is technically proxying the data, comparing Satori results with large datasets which are time-consuming to compute will be biased towards Satori (we do not actually run these computations on all the data, so the added network time is marginal). For this reason, I chose the smallest scale of the TPC-H dataset on Snowflake (TPCH_SF1) for the benchmark testing.
The plan was to run the set of benchmark queries several times, both directly and through Satori, and measure the differences between the loading times.
Nevertheless, one problem I encountered was that, as opposed to TPC-DS, which contains all queries in the Snowflake worksheet, TPC-H only had one query within the Snowflake tutorial worksheet, so I instead ported the queries from my local TPC-H kit installation to the Snowflake SQL dialect, which meant a few syntactic changes. For example, I had to convert the following:
to Snowflake dialect by using the DATE_ADD function: (Yes, I know — I like my SQL uppercase) If you would like to view all of the queries I ported to Snowflake dialect, you can get them here.I then wrote a Python script to iterate through the different queries and measure the time it takes to load the results for each query. I tried to keep everything as simple as possible by using the Python connector instead of Web UI which has a greater risk of external influences, browser hiccups, etc. The core logic of the Python script is as follows:
In this stage, we are iterating through the queries in the queries file, obtaining the test label from a comment placed before each query, starting a timer, and executing the query (either through Satori or directly). Next, we store the test name and record the time it took to get the results in a line. Each timer is set from the time a cursor appears until all the rows from the resultset are consumed. Eventually, we print all of the results in a file. The entire iteration is repeated once through Satori and once directly to Snowflake.
To ensure consistency, I ran each set of 24 queries 100 times without Satori and 100 times with Satori for a total of 4800 query runs. I ran the tests once from my laptop, with a 1gbps fiber internet connection (what a time to be alive), appropriately resembling a realistic human query scenario and once again through a linux server which was otherwise idle, simulating machine-to-machine interaction.
If you would like to view the Python script I used for the benchmarking, you can get it here.The Results Are in...
The results are a relatively simple dataset of test names (the queries from TPC-H) and the times it took to obtain each. Comparing the time it takes to get the results directly with the time it takes to get the results through Satori shows us the “added latency” and answers the question: How much time is Satori adding to the process?
I pasted the results into Google Spreadsheets to view them graphically, and the results are below.
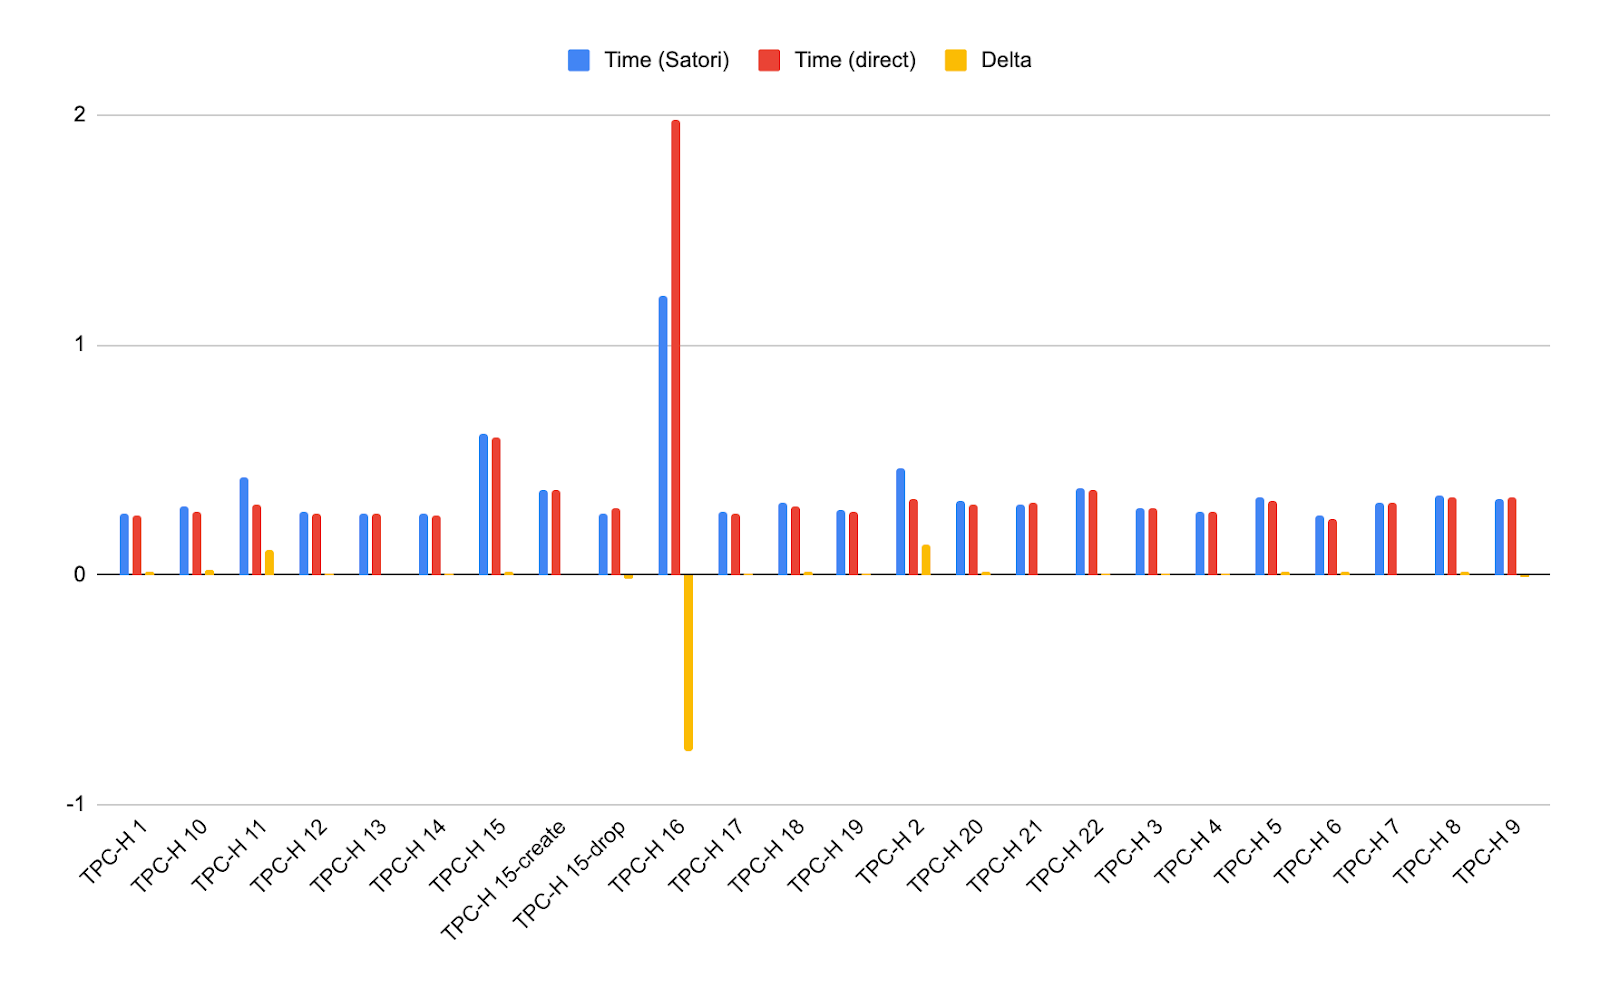
Results from Laptop
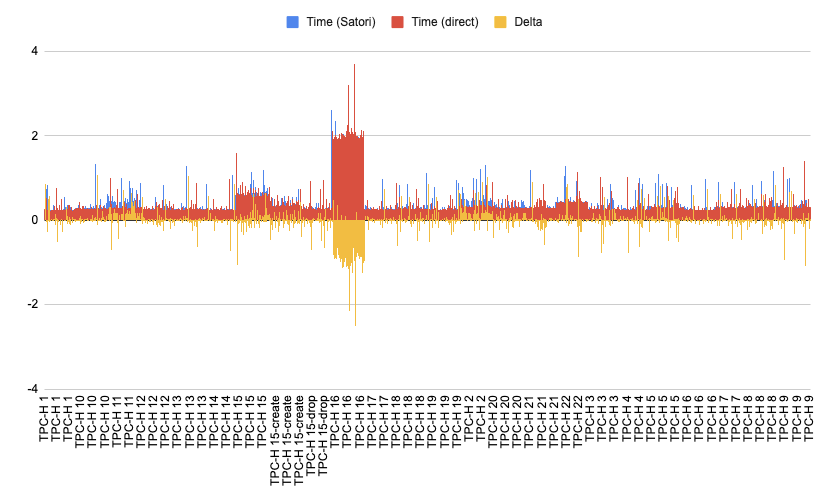
The charts with the results are shown below. The top graph depicts the results aggregated per test, and the bottom graph shows the results without aggregation, demonstrating the consistency between iterations of the same test:
Results from Server
The top chart again depicts aggregated results whereas the bottom chart includes all results and shows consistency.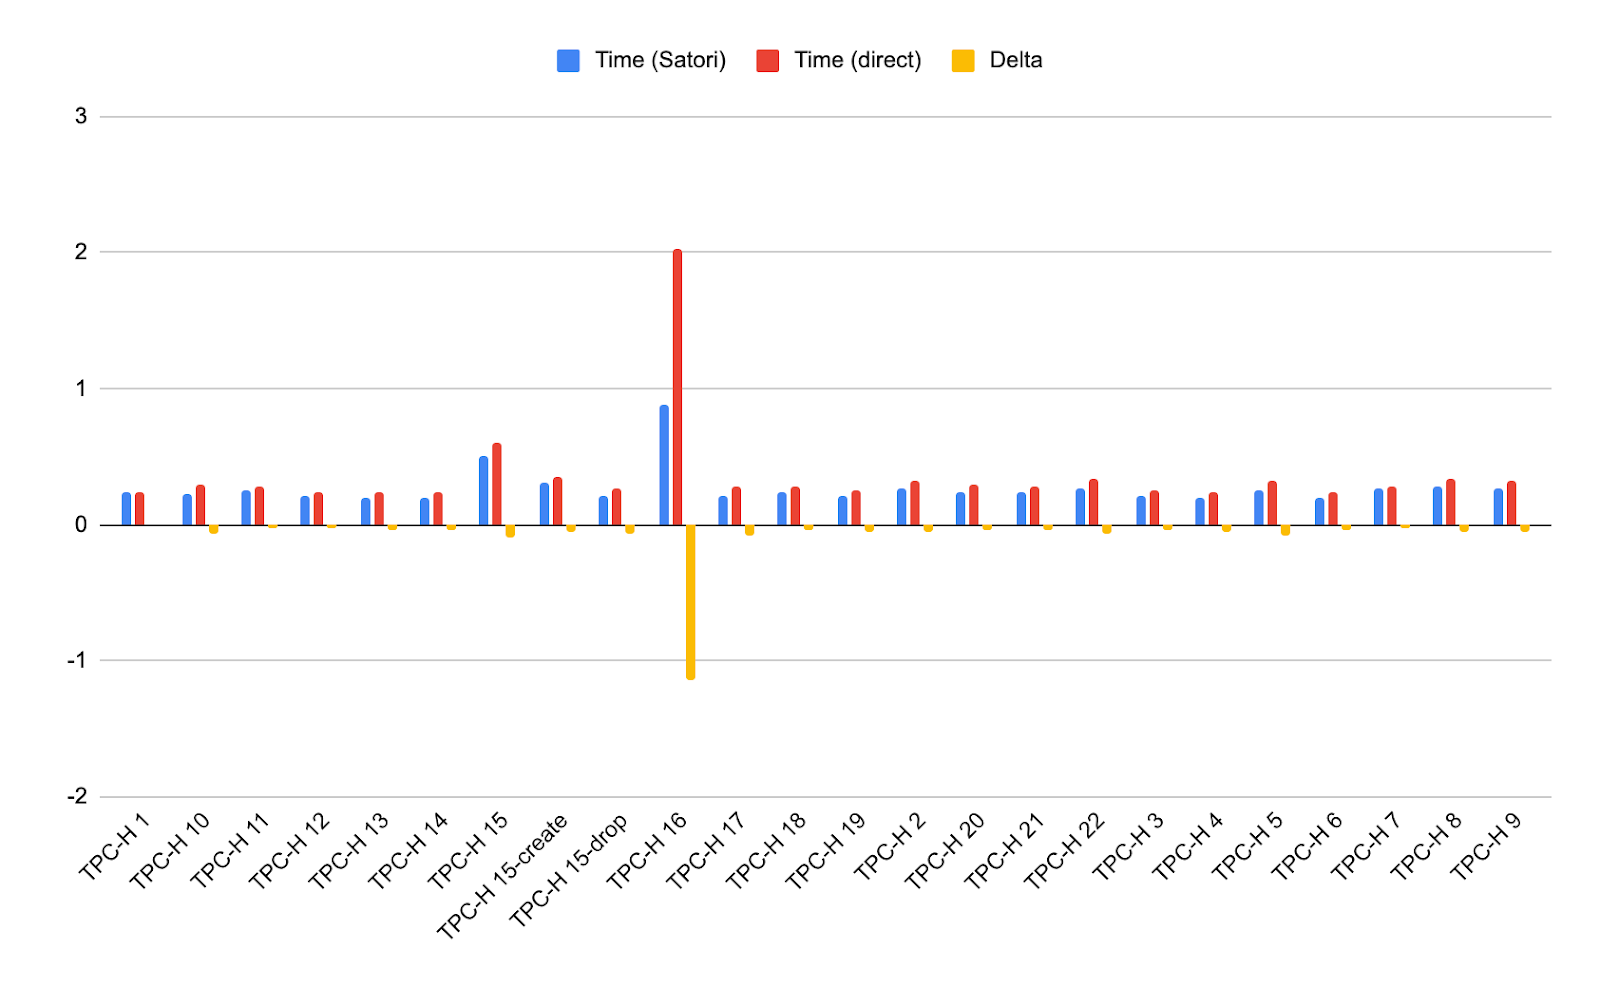

The first thing that I noticed from this experiment was how awesome it was: I sent 4800 analytical queries over a dataset and mostly received the results in well under a second, while using the smallest Snowflake data warehouse (XS). The next observation I made was how each query in the dataset (which I sorted by query) is mostly consistent in its results, with the exception of a few spikes. There are queries which require more resources (like query 15 and query 16), but most of the others are very fast.
We can also notice how sending the queries from an idle server, that is also closer to the datacenter where Snowflake is hosted, provides more stable results, as some fluctuation is caused by “disturbance of the force.”
However, the most surprising finding from my tests was that though all results were fast, the results through Satori were, in fact, actually faster than the results given directly to Snowflake. The Satori results were 4.38% faster than direct Snowflake results when testing from my laptop and 24.89% faster when running from the server.
This means that Satori gives us a “negative latency” , meaning that running the queries through Satori was actually faster. This may be because the wire protocol Snowflake uses is HTTP, which is stateless from a TCP perspective, allowing our proxy to pool and reuse TCP connections to Snowflake. This distinction makes them longer-lived and have a wider TCP window, allowing data to flow out of Snowflake slightly faster. We plan to share more about this phenomenon in the future.
These findings also mean that the time with or without Satori is more than reasonable for running analytic queries on a data warehouse and that, as long as added latency is marginal, using Satori is a very noninvasive access control mechanism.
Though results are even better than expected, I think that, as long as the results provide the same (excellent) user experience, and add the benefits Satori adds (e.g. universal masking, universal audit, and universal access control), the process is very worthwhile. In addition, there are three important performance-related points I feel are useful to note:
-
Within our customers, we are seeing queries which are far more demanding than the benchmark queries. For such queries, which often take much longer to process, the added network latency is not noticeable, since much of the time is spent processing.
- When applying data access control and masking via Satori, you can remove a significant load off of the data warehouse, as some queries do not even need to be processed.
- Satori can also be used to create access policies which prohibit running some CPU intensive queries (like SELECT * from certain large tables).
Conclusion
We work hard to provide great value in simplifying data access control and enabling data governance across different data sources. This work allows organizations to focus on extracting value from their data and spending less time on compliance, security, and privacy ad-hoc projects.
In this work, it is very important for us to be as transparent as possible. This means that we keep the data stores as they are without changing the objects within them (e.g. users, roles, and data objects), do not instal software on end-users’ computers, and do not modify the way queries are written.
Learn More: